|

Understanding what happened in the past, what is happening now, and predicting what might happen in the future is crucial. So how can we gain these insights? The answer lies in data analysis. Today, let's explore the types of data analysis and the data analysis process in research.
What is Data Analysis?
Data analysis is the process of organizing and refining data to obtain useful and relevant information for decision-making. The data analysis process primarily involves three essential elements. This process generates useful statistics, often displayed in charts, graphics, tables, and graphs, to minimize decision-making risks. Its goal is to identify, transform, support decisions, and draw research conclusions.
- Data Organization: Structuring the data. - Data Reduction: Highlighting patterns and themes for easier identification. - Data Analysis: Performing the analysis.
Data analysis is the process of examining raw data to identify meaningful patterns, trends, and insights about specific areas of a business. While most businesses constantly collect data, raw data alone lacks significance. What's important is what you do with the data. The goal is to make informed data-driven decisions by examining, organizing, transforming, and modeling the data to discover valuable insights, draw conclusions, and support decisions.
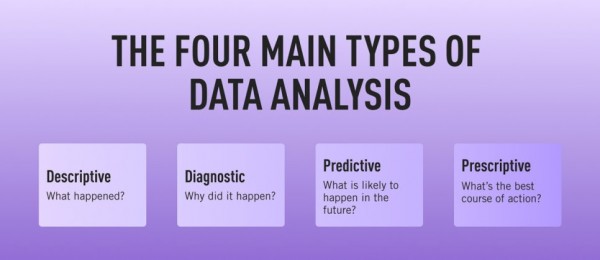
1. Descriptive Analysis Descriptive analytics is used to describe the basic features of various types of data in research. It forms the foundation for understanding all data. It is the simplest and most common type of data in current business contexts. Descriptive analytics typically summarizes past data in the form of infographics, providing an explanation of "what happened." For continuous data, it shows averages and deviations, while for categorical data, it displays percentages and frequencies. Descriptive analytics looks at what has happened in the past. As the name suggests, its purpose is to describe what has happened without explaining why it happened or establishing causal relationships. The goal is to provide an easily digestible snapshot.
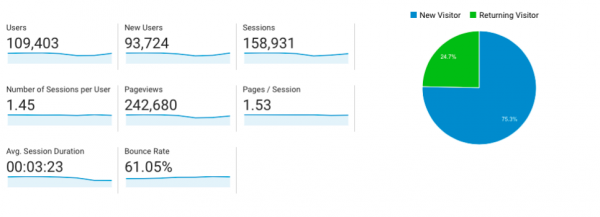
 Google Analytics is a good example. For instance, it provides a simple overview of how many people visited a website during a specific period, where the visitors came from, and what happened on the site. Similarly, tools like HubSpot show how many people opened a specific email or engaged with a campaign. Descriptive analytics uses two main techniques: data aggregation and data mining. Descriptive analytics compresses large amounts of data into a clear and simple overview of what has happened. It often serves as a starting point for more in-depth analysis.
- Data Aggregation: This process collects data and presents it in a summarized format. For example, an e-commerce company may collect data on customers and website visitors. Aggregated data provides an overview of this vast dataset (e.g., average customer age or average purchase frequency). - Data Mining: This involves analyzing data to identify patterns or trends. The results of descriptive analytics are often visual representations of data, such as bar graphs or charts.
2. Diagnostic Analysis Diagnostic analytics uses insights gained from statistical analysis to identify the root causes and answer the question, "Why did it happen?" Generating accurate information is a crucial component of diagnostic analysis. If a new issue arises, detailed information about previous problems might be available, avoiding the need to repeat work. Diagnostic analytics delves deeper to understand why something happened. Its main purpose is to respond to and explain anomalies in the data.
To identify the root cause, analysts may first identify additional data sources that can provide further insights into the reasons for a decline in sales. This can reveal the power of influencer marketing and offer insights into future marketing strategies. Techniques such as probability theory, regression analysis, and filtering are used in diagnostic analytics. Thus, while descriptive analytics looks at what happened, diagnostic analytics investigates why it happened.
3. Predictive Analysis Predictive analytics answers the question, "What is likely to happen?" This type of analysis uses statistical information to make predictions about future events. Its accuracy depends on the depth of information and the thoroughness of the investigation. Predictive analytics aims to predict what might happen in the future. Based on past patterns and trends, data analysts can design predictive models to estimate the likelihood of future events or outcomes. This is particularly useful for businesses to plan ahead.
A predictive model uses relationships between variables to make predictions. For example, it may use the correlation between seasonality and sales figures to forecast periods of decreased sales. If a predictive model indicates a high likelihood of reduced sales in the summer, this information can be used to plan summer-related promotional campaigns or adjust spending elsewhere to compensate.
Machine learning is a subset of predictive analytics. It is designed to recognize patterns in data and automatically evolve for accurate predictions, much like how humans use predictive analytics to create models. Predictive analytics can be used to forecast various future outcomes and, while not 100% accurate, it reduces a lot of guesswork. This is crucial for making business decisions and determining the best course of action.
4. Prescriptive Analysis Prescriptive analytics combines facts from all previous analyses to specify the approach to take in a given scenario or choice. It uses advanced technologies and data management techniques. Businesses must be prepared to invest effort and resources in this type of analysis. A prime example of prescriptive analytics is artificial intelligence (AI).
Prescriptive analytics determines the best course of action by looking at what happened, why it happened, and what might happen. It shows how to best utilize predicted future outcomes. What actions can be taken to avoid future problems? What can be done to capitalize on new trends? Prescriptive analytics is the most complex type, incorporating algorithms, machine learning, statistical methods, and computational modeling procedures. Essentially, prescriptive models consider all possible decision patterns or paths and potential outcomes. By evaluating how each combination of conditions and decisions might affect the future, businesses can determine the best path to take. Frequently cited examples of prescriptive analytics include navigation and traffic apps. Similarly, prescriptive models calculate all possible paths a business can take to determine the best options. Knowing what actions to take to maximize success provides a significant advantage, making prescriptive analytics a critical tool in business.
In essence, data analysis is like treasure hunting. By using clues and insights from the past, you can figure out the next steps. With the right type of analysis, businesses and organizations can use data to make smarter decisions, invest wisely, improve internal processes, and ultimately increase their chances of success.

The Data Analysis Process Step 1. Data Requirements
Consider why you want to perform data analysis. Understand the purpose and choose the type of analysis. Identify what to analyze, how to measure it, and why you're investigating it. Step 2. Data Collection
After determining what to measure and the requirements, collect the data according to the specifications. Structure or process the data for analysis. Keep a log detailing data sources and dates. Step 3. Data Processing
Data must be processed or structured for analysis. This often involves using spreadsheets or statistical software to organize data into tables. Step 4. Data Cleaning
Clean the data to remove any errors, duplicates, or irrelevant information. This ensures that the analysis is accurate and aligns with expectations. Step 5. Exploratory Data Analysis
Once data is cleaned, analyze it to identify accurate information or additional data needs. Use data analysis tools and software to help with conclusions. Step 6. Data Interpretation
After analysis, understand the results. Present findings using simple words, tables, or charts. Use the results to determine the best course of action. Step 7. Data Visualization
Data visualization, commonly through graphs and charts, helps present facts in a way that is easier to understand. It is used to identify new patterns and develop strategies. |
 Click here to book